Summary
- QAF generates json reports that can be viewed using report dashboard. Open
dashboard.htmto view report. - QAF reporting is a powerful and customizable reporting engine ensures that you have access to all relevant test data like test results,check points,test case time, test step time and environment information.Use powerful filters to slice and dice the data to drill down to exact result you seek.
- Comprehensive drill-down reporting, with each step result, step command log and screenshots.
- Live reporting enables you to view reports of executed tests without waiting for entire suite to finish.
- Get Detailed Reporting including Trending,root cause analysis and Automated screen capture.
Reporting of test run includes below details
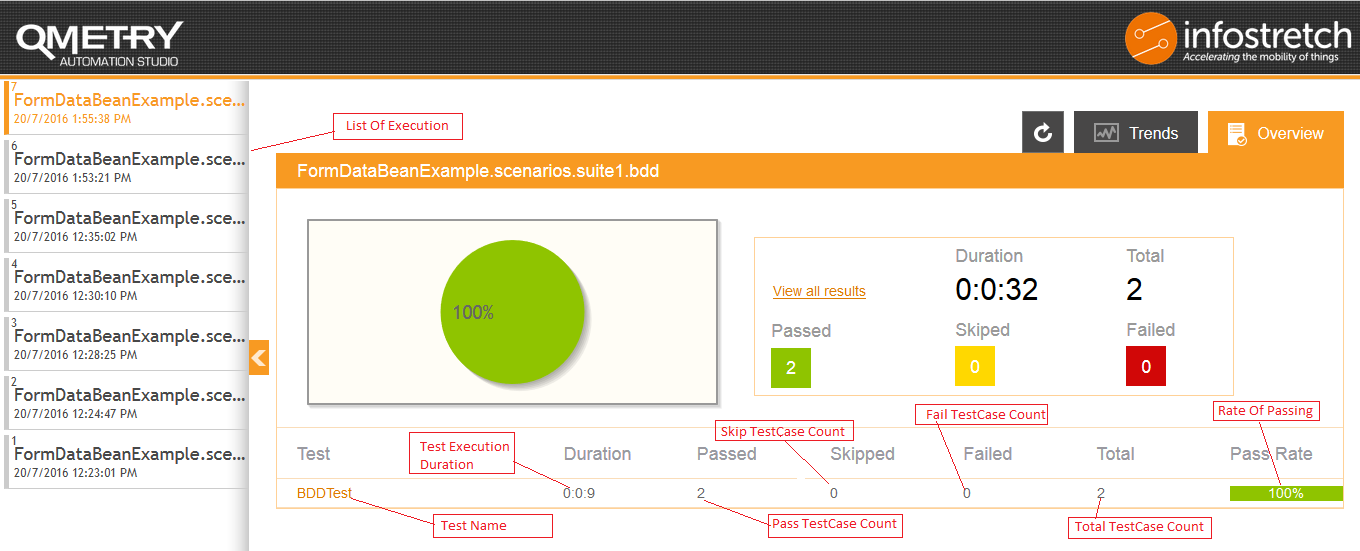
Overview
It summarize details of Over All Execution. It will display basic information about All Test. It shows test name, test execution duration, pass test case count, fail test case count, skip test case count, total test case count execution and rate of passing. Multiple Test Execution can be displayed here. View All Result link shows all test case of all test executed.
Tools and Filter
There 3 types of operation can be perform using Tools And Filter.
- Filter - Test Case can be filtered by pass/fail/skip test case over here. Only Configuration type test case can be filtered by checking Configuration check box.
- Order - Test Case can be ordered by pass/fail/skip or by execution or name.
- Details - All test case details can be expand using Expand All radio button and collapse all test case details using Collapse All radio button.

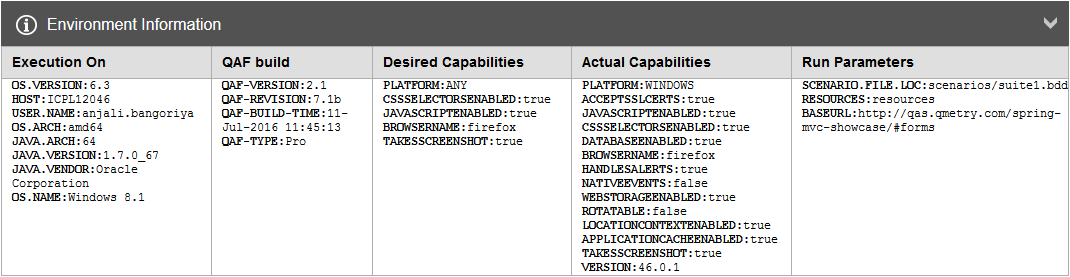
Environment Information
It provides information related to environment with following parameter.
- execution on - To show OS version, java version, operating system etc.
- build information - To shows build related information like QAF version with revision, QAF build time.
- desired capabilities - To shows desired capabilities which describes a series of key/value pairs that encapsulate aspects of a browser. Basically, the Desired Capabilities help to set properties for the Web Driver.
- actual capabilities - To shows actual capabilities which are actually at run time.
- run parameters - To shows run parameters used at run time.
Error Analysis
It provides high level information about automation failure, data failure and application failure. Exceptions categorized into different categories.
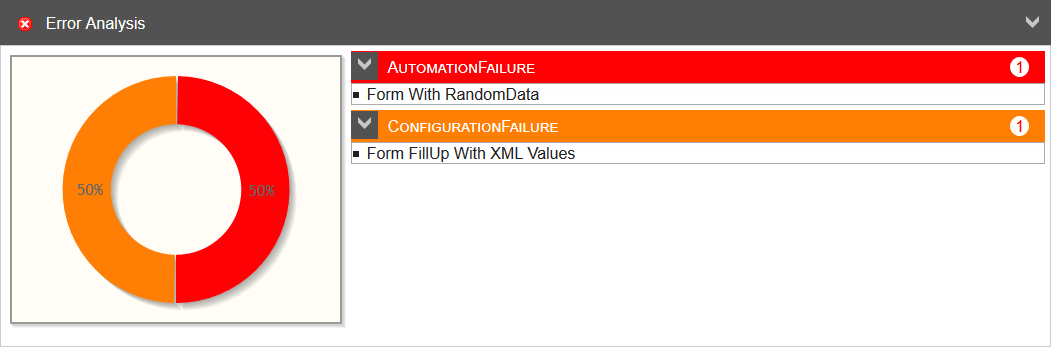
User can customize this error bucket categories in qaf_dashboard.js file.
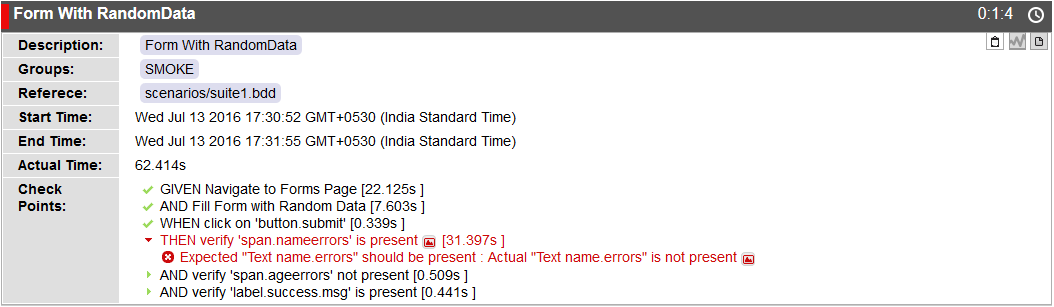
Test Details
After selecting test, it displays test details of test case. It shows useful parameter for test. It has following parameters.
- Description - It shows Test Case Description
- Groups - It shows List of groups on which test cases are executed
- Reference - It shows Location of BDD/KWD
- Start time - It shows Start time of Test Case
- End time - It shows End time of Test Case
- Meta-Data - It shows Meta-Data of Test Case.
- Actual time - It shows Actual Time of Test Case
- Check Points - It shows all steps and sub steps.
Test Case Tabs
There are four tabs available provides detailed steps, timimings, command log and error of steps.
- Check Points(
 ) :- It Shows executed steps and sub steps as checkpoints. Sub checkpoints will be displayed in collapse mode.
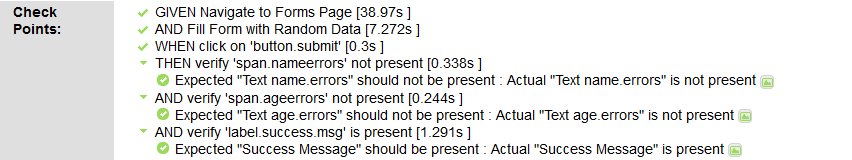
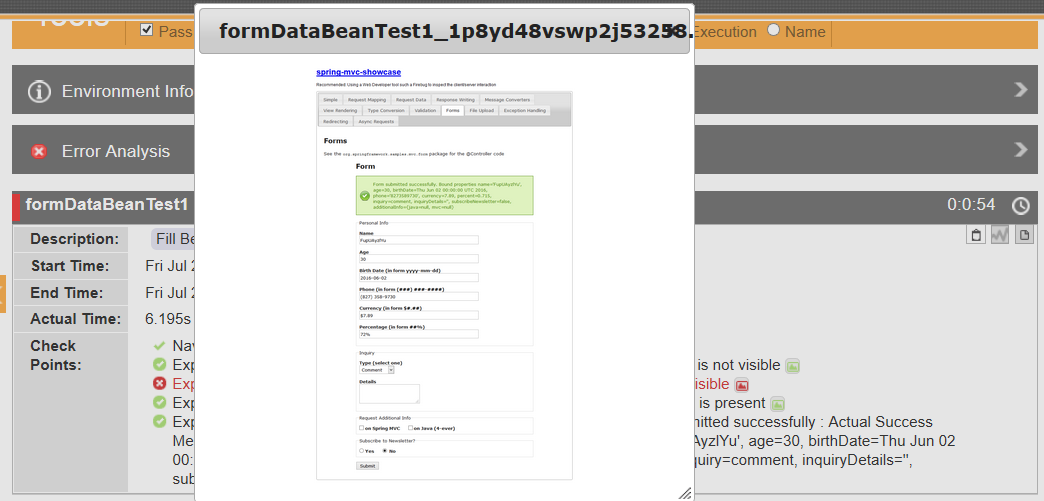
For verification/assertion checkpoint, attachment is also available. Click on  to see screenshots.
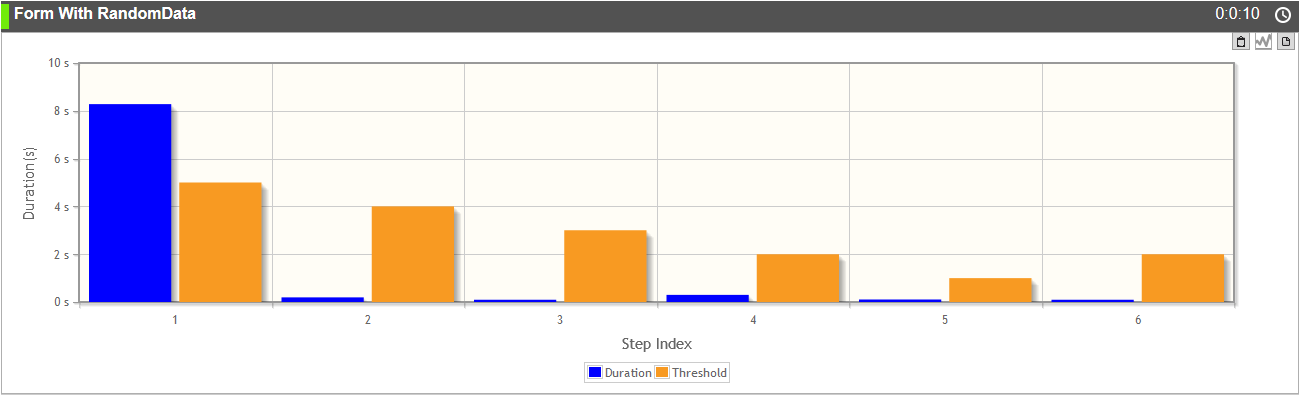
- Step Time Analysis(
 ) - It shows graph for comparing threshold and Duration of steps.
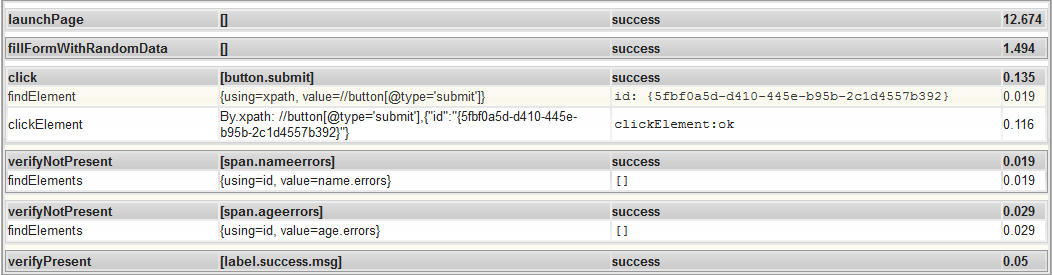
- Command Log(
 ) - It shows log of all command which are executed with command name, arguments, status and duration.
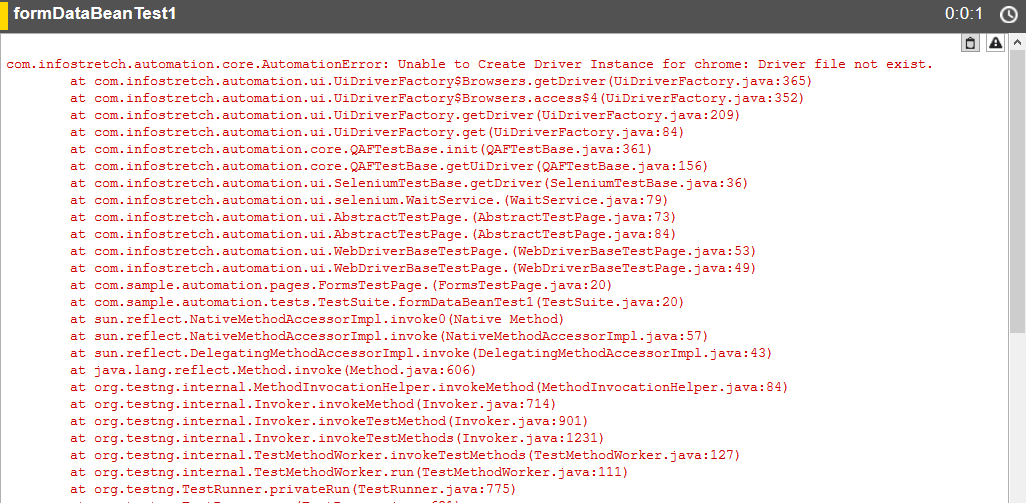
- Error Trace(
 ) - If any error occurred in test case during execution, it will show as descriptive details.. It shows error trace of individual test case. For fail or skip test case, it shows well descriptive error.
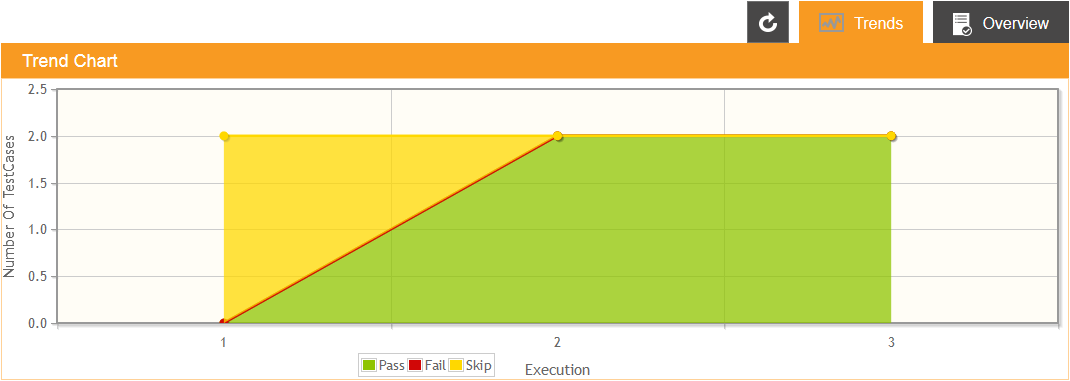
Trending
It shows the trends of all execution respect to all execution and number of test cases.
Live Reporting
Live Reporting can be useful to show result automatically as test results created. Enable live reporting by click on Auto Refresh icon.